

Bullish chart setups – Tiong Woon & Zixin (3 Nov 25) – Ernest Lim’s Investing Blog
Bullish chart setups – Tiong Woon & Zixin (3 Nov 25)
Dear all
Last month has been an extremely busy month with numerous trades; completion of my blog upgrade; back-to-back catch-ups with listcos’ management (before their blackout periods); travelling and rounding it up with a wisdom tooth extraction! Thus, I have not posted anything on my blog. However, I am still updating my clients with daily market updates and specific company ideas. I am also active in my LinkedIn. Readers can check out my LinkedIn HERE especially on some of the exclusive 1-1 meetups with C suite management listcos.
To go straight to the point, there are two companies, namely Tiong Woon & Zixin which exhibit bullish chart setups.
1. Tiong Woon closed $0.810
Based on Chart 1, Tiong Woon’s (TW) chart looks bullish on various fronts.
- Firstly, it seems to have made a bullish break out of its symmetrical triangle formation with a measured eventual technical target is around $0.940. This may not be attained in one go.
- Volume transacted on 31 Oct 2025 was 1.1m shares, the highest since 4 months ago. It was also 5.7x higher than its average daily trading volume for the past 30 days.
- All the moving averages which I track are moving higher accompanied with strengthening indicators such as OBV which closed at a record high.
Other observations
a) TW gross profit margin (GPM) hit 37.6% in FY25, lowest since FY21
Based on channel checks, TW’s GPM is likely to have bottomed in FY25 due to cross hires and product mix. It is likely that the incidence of cross hires (as a result from using 3rd party equipment at reduced margins) is likely to reduce. Consequently, GPM should rebound in FY26F.
b) Net profit should improve
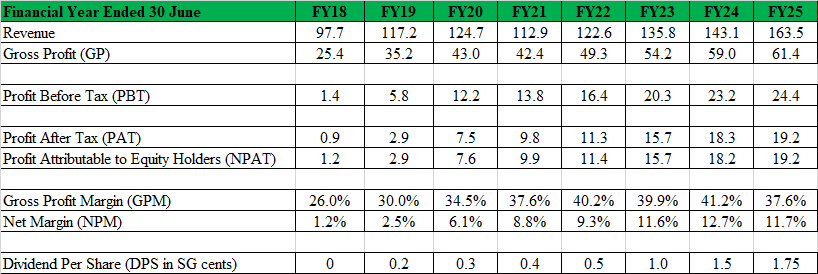
Based on their historical numbers and trend (refer to Table 1 below), revenue has increased consistently in 7 out of the past 8 financial years. With a likely pick up in revenue, coupled with improving GPM, net profit should improve.
Table 1: Impressive track record of growing revenue; net profit and dividends
Source: Company; Ernest’s compilations
c) Raising dividends consecutively in the past 8 financial years
TW’s dividend per share (DPS) has have been rising slowly but steadily for the past 8 financial years. FY25 DPS is S$0.0175 / share, up 17% y/y. TW will ex div on 4 Nov.
d) Attractive valuations
TW trades at 0.58x P/BV (NAV / share $1.39). It is noteworthy that Sin Heng (SH) trades at 0.75x P/BV with an operation scale smaller than TW, albeit with a higher dividend yield. Although not a direct comparable, if we ascribe 0.68x P/BV to TW (10% discount to SH for prudence), TW should trade at $0.94. 1HFY26F results to be out around mid Feb 2026 may provide the impetus for the share price to rally.
Clients can refer to TW’s analyst report HERE to better appreciate the risks. Philip Securities has an informative report on our Construction Sector. Click HERE for the write-up.
2. Zixin closed $0.036
I have actually written at length on Zixin. For more information on Zixin, readers can refer to my write-ups
a) Zixin Group – Management & Investors Committing Millions; Is the Market Overlooking This? (29 Sep 25)
b) Zixin Group Riding the Wave of China’s Food Security and Agri-Tech Boom (20 Apr 25)
c) For this write-up, I wish to draw your attention to Zixin’s chart.
Based on Chart 2 below, it is assuring to see that
- Zixin breached its major downtrend line established since Nov 2017 on 23 Sep 2025 (around $0.034 at that time) with volume expansion. 149.4m shares were transacted on that day, highest since Jan 2021. This was also 10.7x higher than its average daily trading volume for the past 30 days.
- Zixin subsequently tested the resistance turned support region of $0.034 numerous times and closed at $0.036 on 31 Oct 2025.
- I noticed that volume was typically light on days with pullbacks. On those days where Zixin moved higher, volume was usually higher and above the average daily trading volume for the past 30 days.
- Overall, ADX is still elevated at 22.7, amid positively placed DIs. This seems to indicate that the trend is still strong. All the moving averages which I track are moving higher.
Based on Bloomberg, average analyst target for Zixin is around $0.061. Given that Zixin’s 1HFY26F is likely to be announced in the next two weeks, let’s see how it goes. On balance, the path of least resistance seems to be up.
To better appreciate the risks in Zixin, readers can refer to the analyst reports HERE.
Chart 2: Zixin bounced off its major resistance turned support region $0.034 – 0.035
Conclusion
Generally speaking, there are risks involved in investing, especially in small mid-caps. Furthermore, buying ahead of results (potential event risk) is typically risky. Moreover, charts are subjective in nature. Thus, it is imperative to exercise one’s due diligence and make an informed choice, after carefully evaluating the investment merits and risks.
Readers have to assess their own % invested, risk profile, investment horizon and make your own informed decisions. Everybody is different hence you need to understand and assess yourself. The above is for general information only. For specific advice catering to your specific situation, do consult your financial advisor or banker for more information
Readers who wish to be notified of my write-ups and / or informative emails, you can consider signing up at http://ernest15percent.com. However, this reader’s mailing list has a one or two-day lag time as I will (naturally) send information (more information, more emails with more details) to my clients first. For readers who wish to enquire on being my client, I can be reached at ernestlim15@gmail.com.
P.S: I am vested in both TW and Zixin.
Disclaimer
Please refer to the disclaimer HERE