


Over the past 10 years the Nasdaq 100 is up almost 20% per year.
From the March 2009 lows, the Qs are up 22% per year! That's more than a decade and a half with annual returns that would make Warren Buffett blush.
This has been a magical bull market run.
We all know why. The 10 biggest stocks now make up more than 50% of the index. You know the names.
Obviously, the bubble talk is at a fever pitch right now.
Bubbles are difficult to define. You can't just go through a checklist because so much of it is a combination of valuations, expectations and emotions. It's quantitative and qualitative.
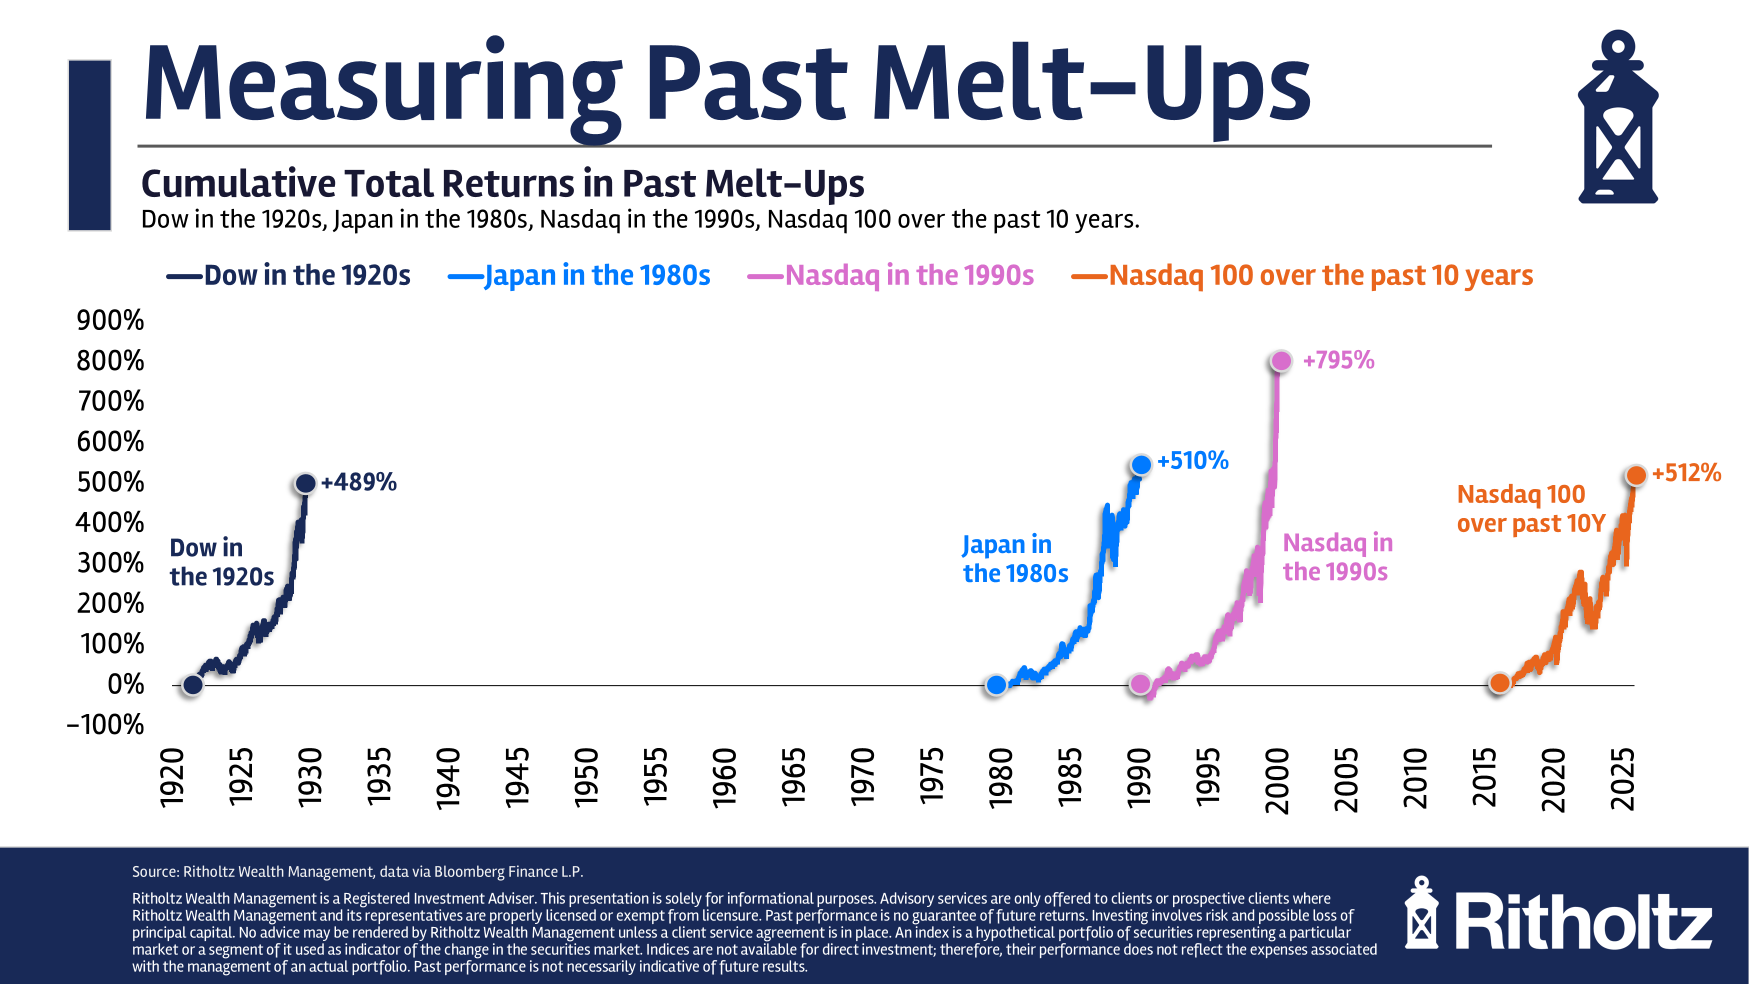
While the numbers don't tell the entire story, I wanted to see how the returns from this cycle look compared to some of history's other great bubbles. So I looked the total return during the Roaring 20s1, Japan in the 1980s and the dot-com bubble in the 1990s to see how the past 10 years in the Nasdaq 100 stack up.
I'm not going to lie — the numbers are slightly concerning:
We're not at dot-com nosebleed levels just yet but the past 10 years are right in line with Japan and the Roaring 20s.
I didn't expect the returns to be this close.
Each of those other cycles ended in tears with a massive crash.
Are we setting up for that again?
I don't know.
A crash is always possible.
Some context is probably required that goes beyond the fact that today's tech behemoths are the best corporations the world has ever seen.
Following the bursting of the dot-com bubble the Nasdaq crashed more than 80%. From 2000-2008, the Nasdaq 100 was down 50% in total or a loss of -8% per year.
From 2000-2013, the total return for the Nasdaq 100 was a gain of 1%. Not 1% per year. That's 1% in total for 14 years. A lost decade and then some.
The annual returns for the Nasdaq from the start of 2000 to now are a more pedestrian 8.4% per year.
That's combining a brutal bear market with a bananas bull market. Is that a full market cycle? 2000 was the peak of the dot-com bubble so it's hard to say definitively.
However you measure it, tech stocks are on an all-time heater. This is one of the great bull markets we've ever witnessed.
So now what?
We could see a crash. It wouldn't surprise me if expectations have gotten too far ahead of fundamentals. That happens during periods of rapid innovation.
I'm much more comfortable forecasting lower returns for tech stocks going forward than an imminent crash from here. That might feel like a cop-out. You could have made the same low return claim many times over the past decade and it hasn't happened.
Tech stocks cannot keep growing at 20% per year indefinitely. I can confidently say that.
Beyond that…maybe this is like the past or maybe this time is different.
Concentrating your wealth in technology stocks has lead to unbelievable returns for many years now.
I strongly believe that diversification will be necessary at some point.
I don't know when.
But that's why you diversify.
Further Reading:
Is This 1996 or 1999?
1Technically the Roaring 20s start in 1921 since there was a bear market and recession in 1920-21. Close enough.
This content, which contains security-related opinions and/or information, is provided for informational purposes only and should not be relied upon in any manner as professional advice, or an endorsement of any practices, products or services. There can be no guarantees or assurances that the views expressed here will be applicable for any particular facts or circumstances, and should not be relied upon in any manner. You should consult your own advisers as to legal, business, tax, and other related matters concerning any investment.
The commentary in this “post” (including any related blog, podcasts, videos, and social media) reflects the personal opinions, viewpoints, and analyses of the Ritholtz Wealth Management employees providing such comments, and should not be regarded the views of Ritholtz Wealth Management LLC. or its respective affiliates or as a description of advisory services provided by Ritholtz Wealth Management or performance returns of any Ritholtz Wealth Management Investments client.
References to any securities or digital assets, or performance data, are for illustrative purposes only and do not constitute an investment recommendation or offer to provide investment advisory services. Charts and graphs provided within are for informational purposes solely and should not be relied upon when making any investment decision. Past performance is not indicative of future results. The content speaks only as of the date indicated. Any projections, estimates, forecasts, targets, prospects, and/or opinions expressed in these materials are subject to change without notice and may differ or be contrary to opinions expressed by others.
The Compound Media, Inc., an affiliate of Ritholtz Wealth Management, receives payment from various entities for advertisements in affiliated podcasts, blogs and emails. Inclusion of such advertisements does not constitute or imply endorsement, sponsorship or recommendation thereof, or any affiliation therewith, by the Content Creator or by Ritholtz Wealth Management or any of its employees. Investments in securities involve the risk of loss. For additional advertisement disclaimers see here: https://www.ritholtzwealth.com/advertising-disclaimers
Please see disclosures here.