


Asset allocation quilt – the winners and losers of the last 10 years
Duvet day at Monevator as we update our asset allocation quilt with another year’s worth of returns.
The resulting patchwork reveals the fluctuating fortunes of the major asset classes across a decade, and invites a question…
Could you predict the winners and losers from one year to the next?
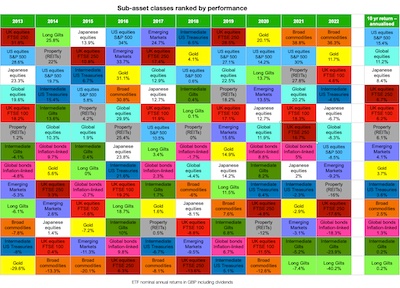
Asset allocation quilt 2025
Data from JustETF, Morningstar, and FTSE Russell. January 2026
The asset allocation quilt ranks the main equity, fixed income, and commodity sub-asset classes for each year from 2016 to 2025 from the perspective of a UK investor who puts Great British Pounds (GBP) to work.
Here’s what you need to know to read the chart:
- Returns are nominal . To obtain real annualised returns, subtract the average UK inflation rate of approximately 3.4% from the nominal figures quoted in the final column of the chart.
- Returns take into account the Ongoing Charge Figure (OCF), dividends or interest earned, and are reported in pounds.
- Again, these are GBP results. If our numbers differ from yours, check that you’re not looking at USD returns. (It’s either that or our minds have been obliterated from staring too long at the crazy pixel explosion above.)
Shady business
While our chart may look like the worst pullover pattern ever, it does offer some useful narrative threads.
For starters we can see investing success is not as simple as piling into last year’s winner. The number one asset in one year typically plunges down the rankings the next. A reigning asset class has only held onto its crown for two consecutive years twice – broad commodities achieving the feat from 2021 to 2022 and gold from 2024 to 2025.
Long periods of dominance are possible – gold has had a spectacular decade. The yellow metal has topped the table three times and only dropped into the bottom half twice in the past ten years (2017 and 2021). It’s even surpassed the annualised returns of US equities in the ten-year return column. Not bad for a lifeless lump of rock.
But the investment gods are fickle. Gold was the second worst performer in the table when we first published our asset allocation quilt in 2021. Which is as nothing to the 31-year bear market gold inflicted on its investors from 1980 to 2011.
This isn’t some strange quirk that only pertains to shiny dubloons. Any investment can suffer multi-decade declines. That’s why diversification is so important.
Getting defensive
Disillusionment with bonds has been a major talking point round these parts since the asset class crashed in 2022.
Many Monevator readers have retreated into cash since then.
But though cash (in the shape of money market funds) has beaten UK government bonds (gilts) since 2021, gilts have trashed cash over longer periods.
Notice how badly money market lost to intermediate gilts from 2016 to 2020. Dig deeper into the historical record and you’ll discover that average gilt returns are twice as high as the money market’s.
However, high inflation periods – as per 2022 to 2023 – are government bond Kryptonite.
Gold, commodities, and index-linked gilts are all good – if imperfect – countermeasures during inflationary episodes.
Hence, it’s worth understanding the full range of defensive assets: nominal government bonds , short index-linked government bonds, commodities, gold, and of course cash.
At least one of those asset classes usually rides to the rescue when the stock market chips are down. As ably demonstrated by the All-Weather portfolio and the Permanent Portfolio.
A chequered past
Notice how commodities and gold occupy two of the top four places in the 10-year column right now.
Yet broad commodities was at the foot of the table in 2021 – with gold joining it in table-propping ignominy, as previously mentioned.
You can see from its returns how volatile broad commodities is: swinging from agony to ecstasy like a volcanic situationship.
Gold is like that too, though it’s true nature is disguised by its current hot streak.
Equities and longer-dated bonds can be just as fickle.
But what makes these odd bedfellows work together in a portfolio is their tendency to come good at different times. To cover for each other’s weaknesses. To deliver a decent overall result in the long run.
Diversification is less risky than betting the farm on whatever’s worked recently.
Even US stocks can suffer lost decades. The S&P 500 lost 4% per year from 1999 to 2008 before grabbing the lead from the rest of the world in the aftermath of the Global Financial Crisis.
Stitch in time
However you weave your response to the challenges of investing, the asset allocation quilt makes it plain that the best way to anticipate the future is to be ready for anything.
Instead of trying to predict next year’s winner, discover the strategic rationale that makes each of the main asset classes worth holding.
Buy into the assets that suit your objectives and investing temperament then reap your reward when their day – or year – comes around again.
Finally, as uncertainty abounds, let’s be thankful that if you banked on the default position of global equities then you did just fine.
In fact, more than fine over the last decade. That 12.8% annualised return – 9.5% in real terms – is phenomenal!
Take it steady,
The Accumulator