


The 1987 Black Monday crash was so swift and severe that some were questioning whether it was the signal of an oncoming depression:
Most people didn’t actually think 1987 equaled 1929 but the crash was painful enough to cause pundits to at least consider the possibility that an economic calamity was on the horizon.
The stock market fell more than 20% in a single day and nearly 35% over the course of a week but the economic impact was…nil.
The next recession in the U.S. didn’t hit until the summer of 1990. The stock market finished the year with a gain of around 5% in 1987 and was off to the races following the crash.
The stock market wasn’t big and powerful enough to cause an economic downturn. That’s mainly because not that many people owned stocks back then. In 1987, around 25% of U.S. households owned stocks in any form — individual stocks, mutual funds, etc.
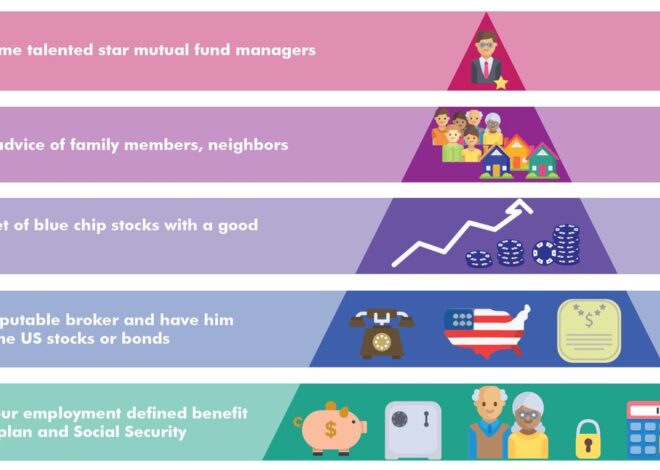
You can see that stock market ownership didn’t really take off in a meaningful way until the 1990s:
This chart is a couple of years old. Today the number is 62% of households that own stocks. This increase in ownership means the stock market is far more important to more people than it was in 1987 (duh).
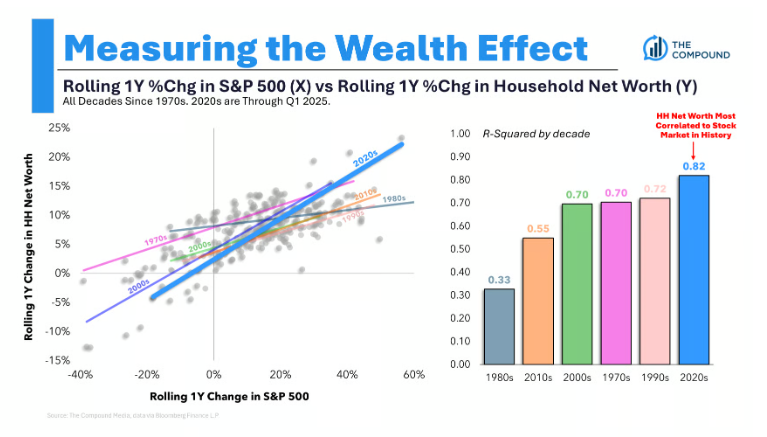
Chart Kid Matt has an excellent chart that shows how net worth has never been more intertwined with the stock market:
You can see the huge leap this relationship has taken since the 1980s.
Here’s a good stat from The Wall Street Journal that cements this idea:
Stocks as a percentage of household financial assets surged to 36% in the first quarter, the highest level in records going back to the 1950s, according to Ed Clissold, chief U.S. strategist at Ned Davis Research.
Now some people look at this data as a cause for concern. A rising stock market could be causing more households to spend money more loosely.
If the market rolls over, that could cause households to cut back on consumption. No one knows if this wealth effect will show up for sure but it’s certainly worth considering.
A rising stock market is also likely driving up spending for the wealthiest subset of the population. The top 10% own nearly 90% of the stock market.
According to The Washington Post they are also driving most of the spending:
“In the near term, everything rests on what that top 10 percent decides to do or not to do. The rest of the income distribution is really not consequential from a macroeconomic perspective,” Mark Zandi, chief economist at Moody’s, told me.
Zandi finds that the top 20 percent of households continue to grow their spending, though they have pulled back somewhat amid so much uncertainty. Meanwhile, the bottom 80 percent of households are basically just keeping their spending growth in line with inflation. This is a notable shift from the “revenge spending” era from 2022 to 2024, when people of all income levels were splurging somewhat after the end of pandemic lockdowns.
This chart says a lot:
This isn’t all the stock market of course. This group also makes more money.
Essentially this is a chicken-or-the-egg issue — will a slowing economy cause the stock market to fall or will a falling stock market cause people to rein in their spending?
It’s hard to say which one comes first.
The growing importance of the stock market on the economy is good news. Having more people investing in stocks is a sign of progress. I hope it continues.
But it will be interesting to see if this growing importance eventually has an impact on the economy.
Can the stock market cause a recession?
The possibility is higher today than it’s ever been.
Michael and I talked about the growing importance of the stock market on the economy and much more on this week’s Animal Spirits video:
Subscribe to The Compound so you never miss an episode.
Further Reading:
The Top 10%
Now here’s what I’ve been reading this week:
Books:
This content, which contains security-related opinions and/or information, is provided for informational purposes only and should not be relied upon in any manner as professional advice, or an endorsement of any practices, products or services. There can be no guarantees or assurances that the views expressed here will be applicable for any particular facts or circumstances, and should not be relied upon in any manner. You should consult your own advisers as to legal, business, tax, and other related matters concerning any investment.
The commentary in this “post” (including any related blog, podcasts, videos, and social media) reflects the personal opinions, viewpoints, and analyses of the Ritholtz Wealth Management employees providing such comments, and should not be regarded the views of Ritholtz Wealth Management LLC. or its respective affiliates or as a description of advisory services provided by Ritholtz Wealth Management or performance returns of any Ritholtz Wealth Management Investments client.
References to any securities or digital assets, or performance data, are for illustrative purposes only and do not constitute an investment recommendation or offer to provide investment advisory services. Charts and graphs provided within are for informational purposes solely and should not be relied upon when making any investment decision. Past performance is not indicative of future results. The content speaks only as of the date indicated. Any projections, estimates, forecasts, targets, prospects, and/or opinions expressed in these materials are subject to change without notice and may differ or be contrary to opinions expressed by others.
The Compound Media, Inc., an affiliate of Ritholtz Wealth Management, receives payment from various entities for advertisements in affiliated podcasts, blogs and emails. Inclusion of such advertisements does not constitute or imply endorsement, sponsorship or recommendation thereof, or any affiliation therewith, by the Content Creator or by Ritholtz Wealth Management or any of its employees. Investments in securities involve the risk of loss. For additional advertisement disclaimers see here: https://www.ritholtzwealth.com/advertising-disclaimers
Please see disclosures here.